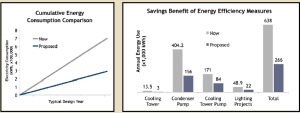
Additional capital equipment installation is often driven by the use of industry standard practices being applied to the unique operating characteristics of a building, rather than the other way around. Building data collection allows for real savings calculations in advance of any scope decisions. Consider the decision not to install a VFD on a cooling tower fan at the Flood Building. The VFD would have had a 25-plus-or-minus-year payback. Known cooling tower fan energy usage and full year modeling of the Flood Building’s cooling tower and its interaction with the cooling system revealed the benefit, or lack thereof in this case, of this measure.
The retail spaces each had unique operating hours on different days of the week to accommodate shopping, restocking and display changes. Careful monitoring of outdoor-air conditions and ongoing scheduling checks were implemented at the Flood Building to ensure energy is not being used when heating or cooling is unnecessary. Pump 1 (P-1) and Pump 4 (P-4) provide primary cooling for the condenser loop during normal business hours. P-1 serves the cooling tower, and P-4 serves the watersource heat pumps (WSHPs). During most hours of the year, P-4 provides sufficient circulation to cool the WSHPs. Pump speed is set to match a predetermined differential pressure, which corresponds to a particular cooling need. Additional pump operation is limited to very warm weather days (few and far between in San Francisco) when additional cooling will be required, thus minimizing the amount of pumping energy for the entire system.

Building Value = Net Operating Income / Capitalization Rate
Net Operating Income (NOI) is the net profit a building generates each year, or rent minus costs. Building value and net operating income are directly proportional, and an increase in NOI through a reduction in energy costs will result in an increase in building value.
For modified gross leases, utility and other operating expenses are passed through to tenants based on square footage, submetering plus common area maintenance charges or base-year calculations. The Flood Building’s retail tenants have a modified gross lease and utility expenses are passed through. Reducing energy spending lowers their effective real-estate costs and the savings from energy-efficiency projects can pay for themselves over time. By splitting up project payments to Carbon Lighthouse across multiple calendar years, the savings from the project exceed the costs to the tenants and the result is a cash-flow positive project from day one.
Project Outcome
Carbon Lighthouse engineers completed the project in November 2012, following a period of post-implementation measurement and verification. Carbon Lighthouse and Flood Building management went through a full handoff of the project to relay relevant changes and new protocol. One year after the project, Carbon Lighthouse engineers will return to the site and largely repeat Phase One for a full-system measurement and verification.
In the first year, the building’s tenants will realize a 15 percent reduction in their utility costs, translating to savings of $1.2 million during 15 years without ownership capital. Ultimately, the Flood Building is a carbon-neutral building with a 20 percent internal rate of return, increased energy visibility for building management, new building controls and improved environmental performance. The Flood Building is poised to continue marching into its second century of operation as an environmental leader and a bridge to San Francisco’s past, present and future.
Retrofit Materials
Lighting: Sylvania
Monitoring equipment: HOBO data loggers from Onset
Energy modeling software and financial analysis tool: Carbon Lighthouse

